CS:GO
Summary
The main purpose of the CS:GO project was to do an end-to-end project (data gathering to prediction), but this time using more data visualization. This culminated in a project for a Master’s class focused on sports data and analysis (right up my alley). The work on this project occurred during the 2020 Coronavirus pandemic, but maybe I’ll revive it if there is enough interest or time.
The Shiny App
R Shiny is an interactive web app framework using R, kind of the R analog to Python’s Flask.
My goal with the app was to create something that resembled a modern website, which you may note deviates from my About Me page, in which I say I am a fan of minimalist websites. I used this project to test that philosophy, and since I had nowhere to publish it at the time, I knew it likely would be perfect for the class since it was pretty full featured.
Home Page
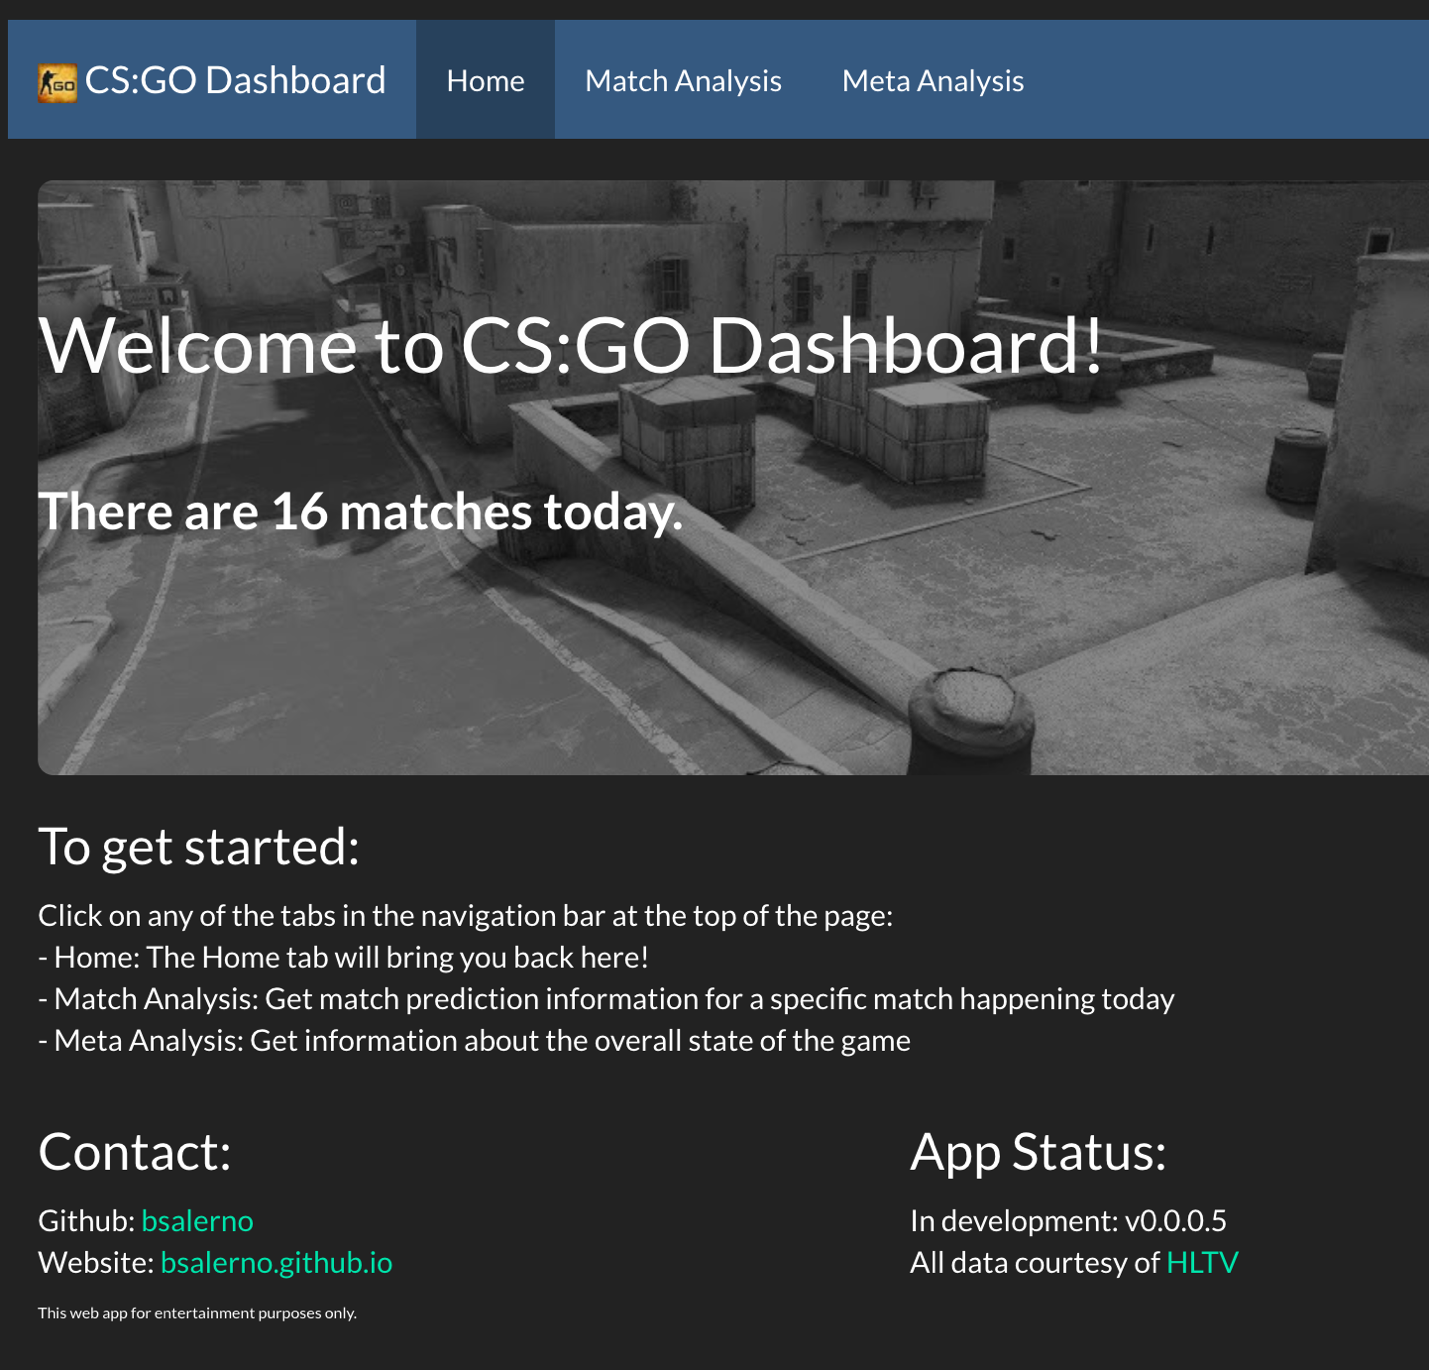
The home page contains a welcome to the site and a count of the number of matches to occur that day.
Match Analysis Page
This page is the main page of the application. The objective is to display information pertaining to a single upcoming match, which is selected using the dropdown menu.
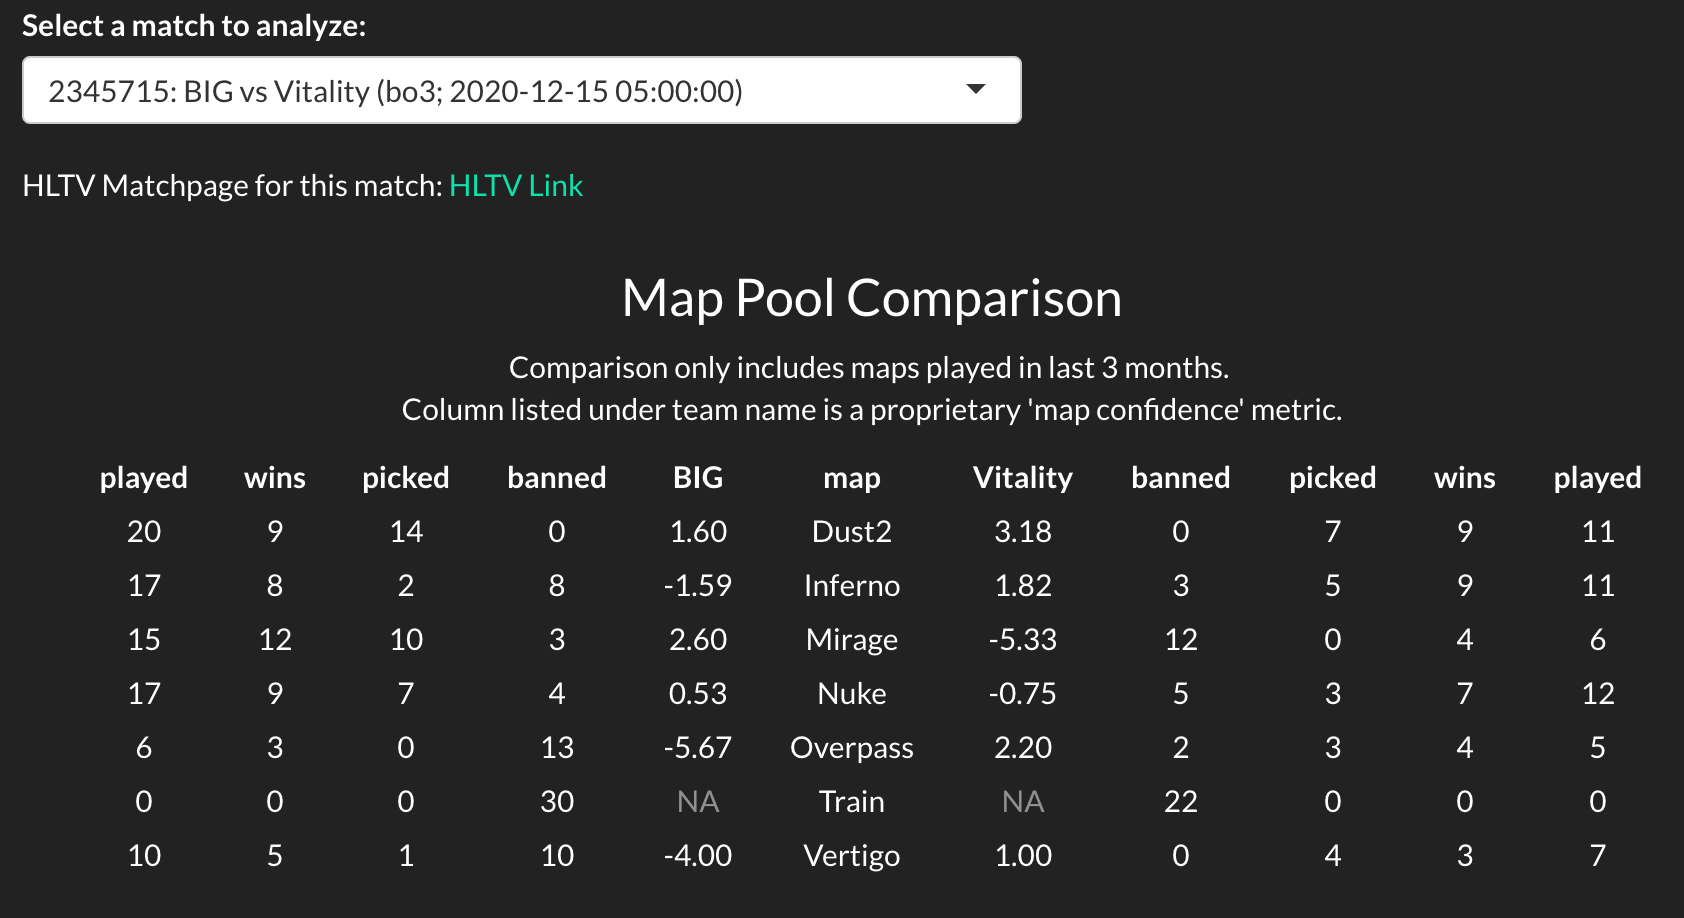
The map pool comparison shown in the image is a summary of the teams’ strengths and weaknesses on each map within the current map pool. The table is meant to demonstrate which maps are more or less likely to be played and in what order. The metric under the team names (BIG and Vitality, in this case) is an overall estimate of the team’s strength on a map (positive is good) based on their performance on that map as well as their tendency to pick and ban that map (this is a fun matchup since both teams do not like to play on Train as seen by their tendency to ban this map).
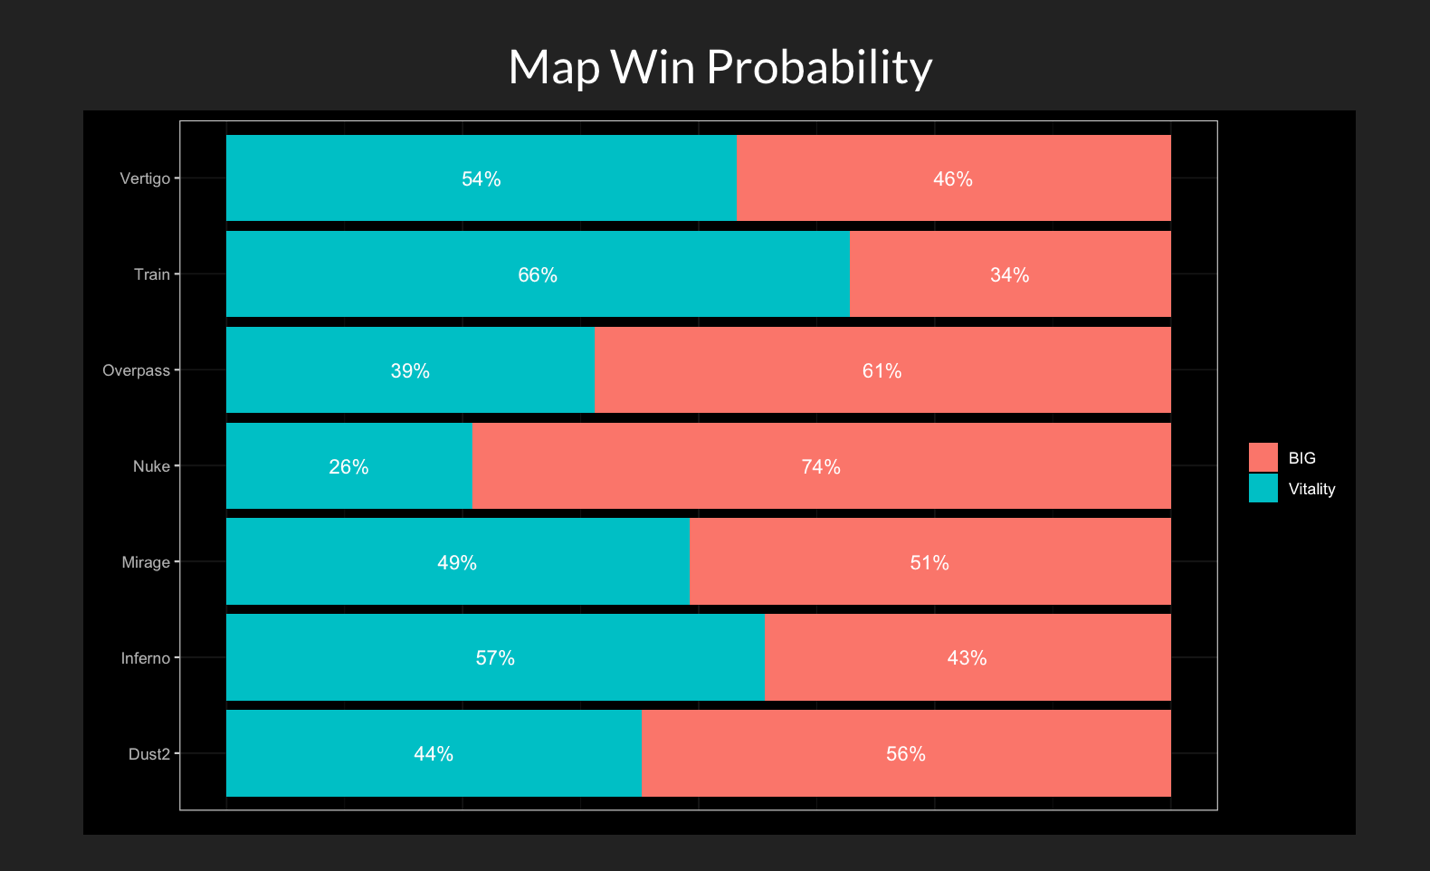
Scroll down from the Map Comparison table to find the map win probability table. This table is meant to represent the overall probability for each team to win the map if that map is to be played in the match.
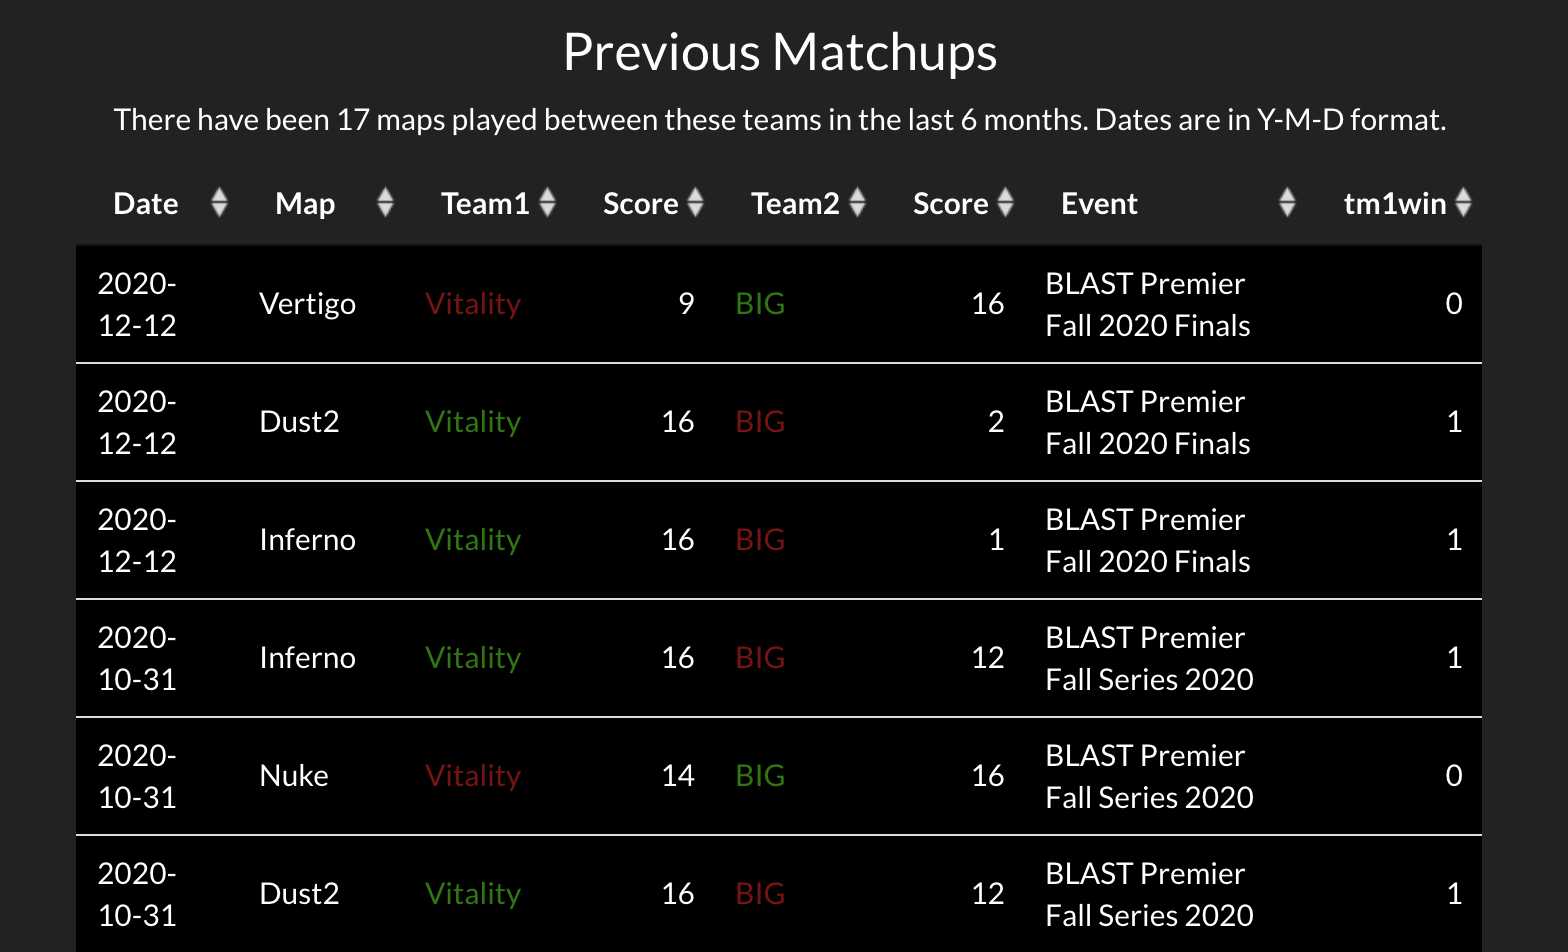
Finally, a table displayes the results of previous matchups between the two teams. The red and green indicate the loser and winner, respectively, of the map played on the displayed date.
Meta Analysis Page
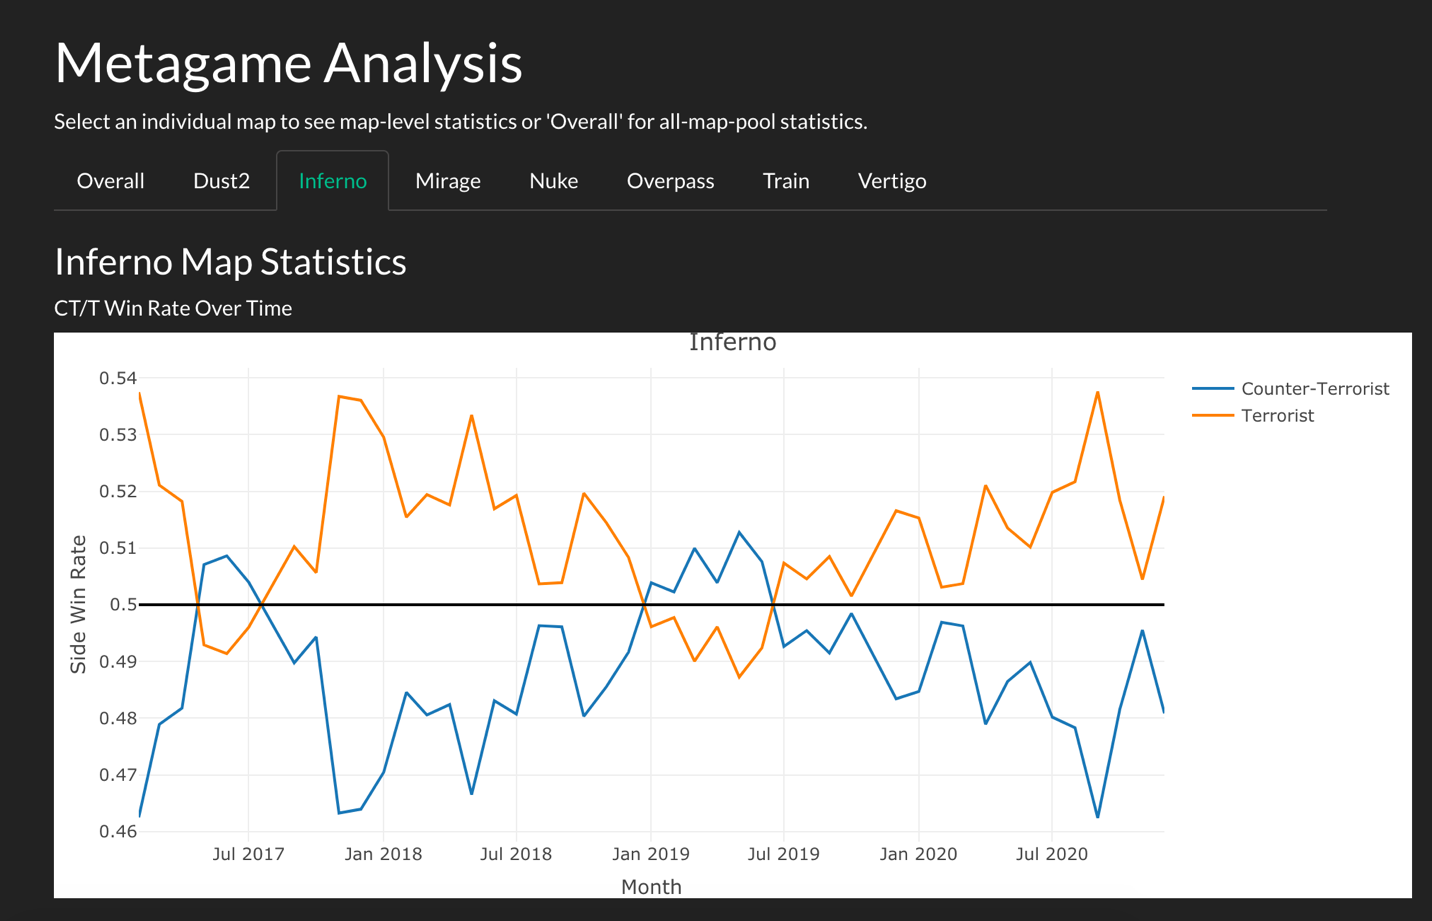
The goal of this page is to provide high-level statistics about the “metagame”, or how all teams are performing within the game on certain maps. This is important because as game trends and updates come and go, the way that teams approach the map (and how they perform) changes over time.
